
New data! We seem to be leveling out around 1000 tests per day – I’d rather see that increasing, but there’s a shortage of them. Grr. See my earlier note today about my frustrations and the limitations in the data we’re getting.
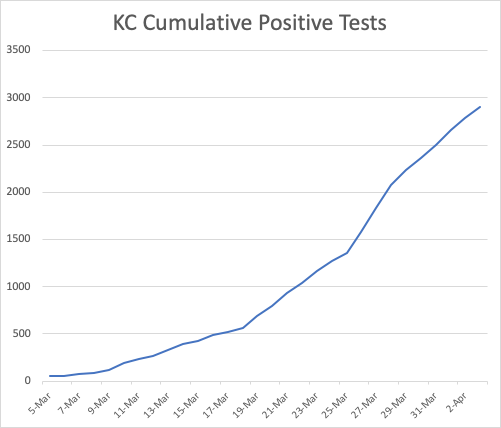
It’s increasingly easy to see that we’re flattening the curve. The cumulative curve (which remember can never go down) is bending down and away from a scary exponential.
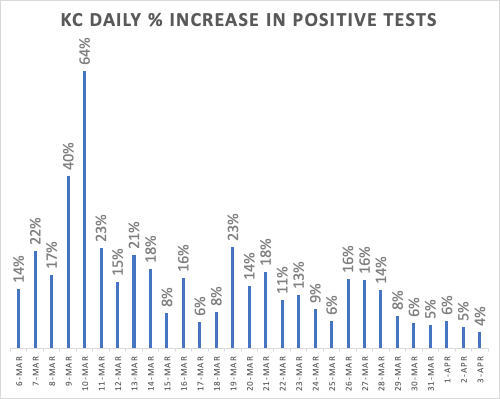
The trend is clearer in the “% increase” chart. Our growth rate is now contained and decreasing over time – today was an all time low 4%.
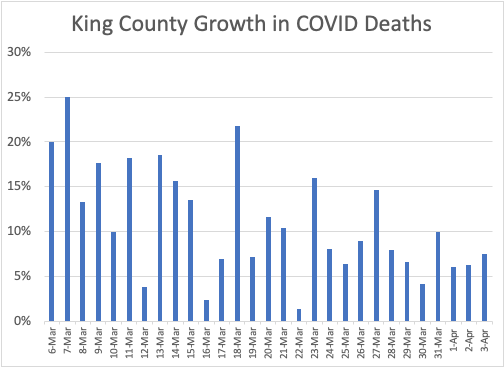
Death growth rate is also dropping, but it’s noisier because our actual death number is so small and noisy. I think this laggiest of measures (deaths today reflect actions we took 25-30 days ago) is probably leveling off, but we’d like to see it start dropping.
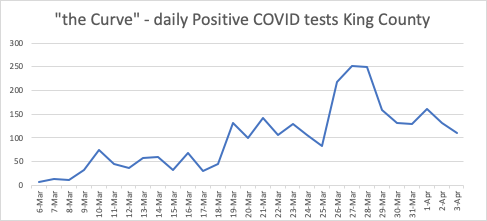
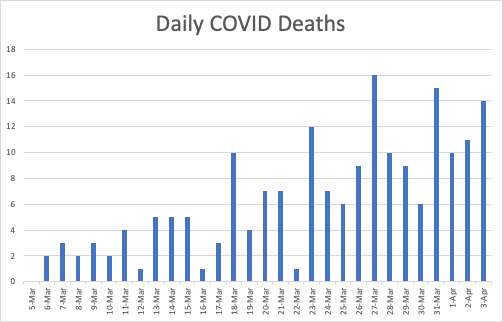
Finally, “the curve” – the absolute number of positive tests per day. It sure looks like we peaked on the 27th-28th of march at 250 per day and now are down to half that. But see my previous note for some reasons even large drops in population cases could take a long time to show up if we don’t get more tests.
