Our growth in infections continues to bounce around a very low level, but never level off to zero. We are now entering a period where our data will make infection measurements almost impossible.
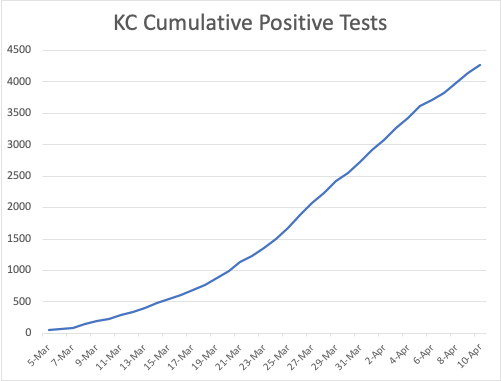

To understand why, consider what’s probably going on. We still have COVID-19 in our community, but in shrinking numbers. As we are locked down, our actual numbers of infected folks is dropping towards some low asymptote in the hundreds or thousands that are driven by essential workers, nursing homes, and social-distancing cheaters. Let’s say this number is around 200 people.
But we’re still testing all the sick people with our precious, limited tests. That means as we go from 5000 to 1000 to 200 infected, they all go the ER and get tested and we’ll continue to add a couple of hundred new cases per day even as our actual infections drop. Of course eventually we might get to essentially zero cases, at which point even fixed numbers of tests will start to show fewer infections. And this problem is even worse if (as is likely) our testing increases.
Of course, I can’t even estimate this right now because Washington and King County aren’t releasing new negative test data. But it’s surely a problem. So what we should expect is to see our new test data essentially never hit 0 per day, but hit a low level of growth. This is irritating.
To really solve this we’d need enough tests to do random sampling, and good enough tests to get no false positives and fast turnaround. We’re nowhere near that point.
Our next best indicator is thus deaths. These are reasonably clear (although there’s a risk of underestimation if people die untested).
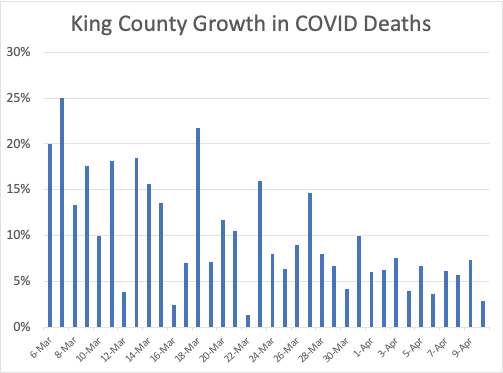
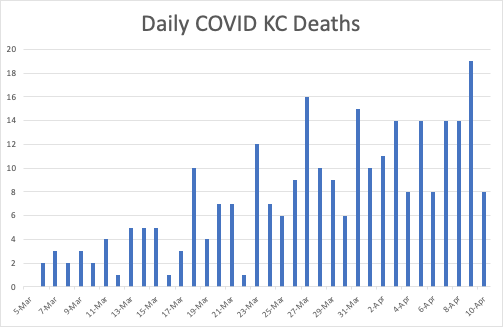
This data about deaths has been gradually slowing it’s growth rate, but seems to be steadily ticking along at what is really a very low number. This indicates we were very aggressive in our response and stopped the pandemic from killing people before it could really get started. Still, 8-18 people per day shows that it was still circulating in our community, especially nursing homes, pretty actively 2-3 weeks ago.
In looking at the data for several states, I realize that there’s a clue to part of the time course and lag of COVID-19. Take a look at this table:
| First Community Spread | First death | Lag (Days) | |
| WA | 1-Mar | 4-Mar | 3 |
| FL | 4-Mar | 11-Mar | 7 |
| IN | 6-Mar | 14-Mar | 8 |
| MI | 11-Mar | 19-Mar | 8 |
| CA | 4-Mar | 12-Mar | 8 |
| KY | 7-Mar | 16-Mar | 9 |
| NY | 4-Mar | 15-Mar | 11 |
| OH | 9-Mar | 20-Mar | 11 |
| MN | 7-Mar | 21-Mar | 14 |
| LA | 9-Mar | 24-Mar | 15 |
| ME | 12-Mar | 27-Mar | 15 |
| MA | 4-Mar | 20-Mar | 16 |
| NE | 7-Mar | 28-Mar | 21 |
| Average | 11.23 |
This random sampling of my favorite states (yes, I’m too lazy to grab all 50 – hire an epidemiologist) holds a couple of clues.
On average, it appears it takes the virus about 14 days after people start getting sick enough to seek a test to kill them. But WA is clearly a standout. I think this confirms what some epidemiologists said at the time: We had really serious community spread for about a week before we identified our first spread.
It also shows that today’s deaths reflect our past state of infections by more than a couple of weeks. So stay tuned and keep up the distancing.
