
My last post was about the lag between opening up, cases, hospitalizations, and death. Based on that analysis, I proposed the following sequence of effect with Coronavirus:
Behavior change -> (48 days) -> new cases change -> (6 days) -> hospitalization change -> (23 days).
This was very consistent on the way up, after opening up and starting to mix and mingle. Recent data from hotspot states starts to give us a good test of how it works on the way down.
Let’s take Arizona:
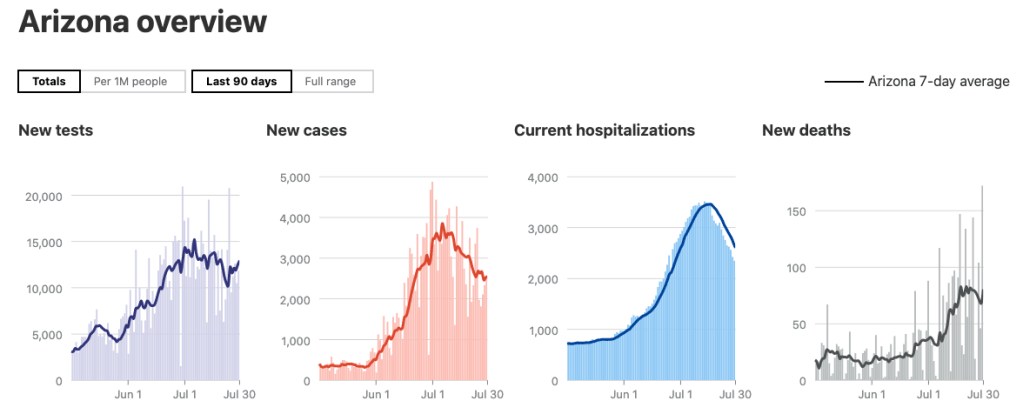
AZ was spiking hugely on all metrics, but new cases appear to have started to turn the corner on July 7 (implying they began to modify behavior in early June). Hospitalizations turned 6 days later on July 13, fitting perfectly. Deaths are a bit vague as they may have turned down but are showing signs of life again, but the first signs were on July 21, 14 days later, a bit early for my model. It would predict that they will have another week of growth ahead of them, hitting 200 deaths per day before that happens, but we’ll see.
Florida
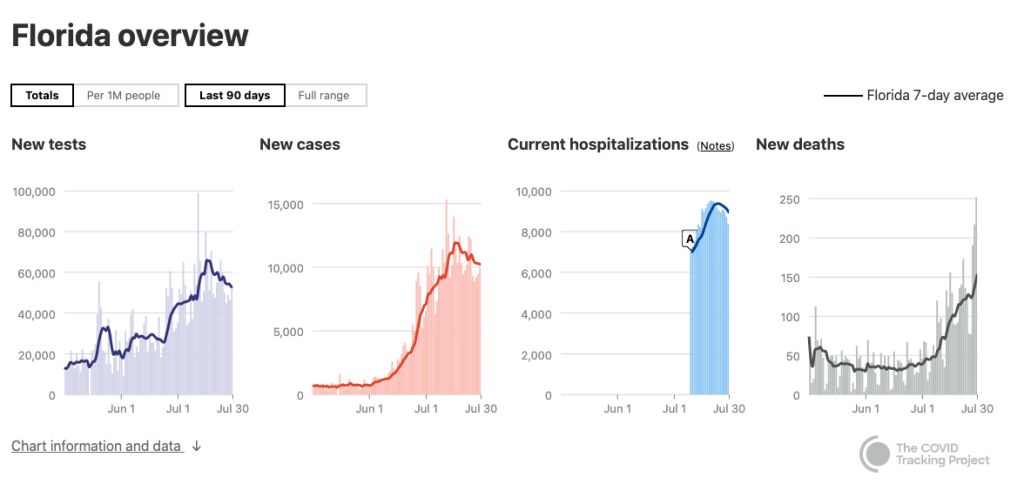
Florida had cases start to drop July 17 (behavior change in the first week of June), Hospitalizations right on schedule on July 23. Deaths haven’t responded yet and are on a skyrocketing course, but based on the model we’d expect those to start turning on August 15 or so. Sadly, that predicts another 2 weeks to rocket skyward before they drop. At the current rate, that would put them doubling again, hitting around 400-500 deaths per day before finally abating.
Texas
Texas is a sad case, with skyrocketing numbers.

Texas turned cases on July 22 (behavior change around mid June), hospitalizations on July 27th (5 day lag). Deaths haven’t turned and in fact are skyrocketing; the model would predict they’ll start to turn deaths around August 20, but not before tripling their current death rate to 1500 or so deaths per day. Even I have to pause at that grim prediction, and hope that the less decisive turn Texas took earlier in July portends an earlier change in the death rate growth, if not an actual turnaround.
