
One of the biggest attributes of the epidemiology of COVID has been lags – it takes time for things to change. Generally, with the states that are experiencing this new wave, we’ve seen a clear sequence:
- The state opens up and people start moving around
- the state sees a surge in cases
- the state sees a surge in hospitalizations
- the state sees a surge in deaths
These happen in this order again and again. But how long does each take?
I’ve informally looked at various sources to measure this and have computed dates and lags:
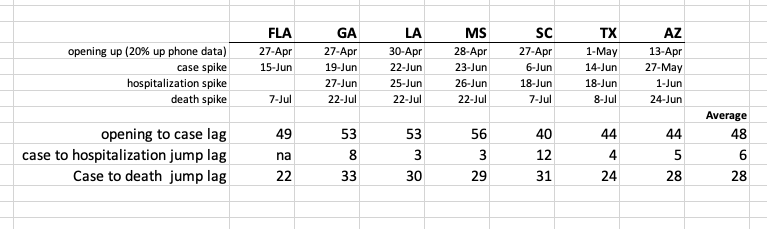
The states are remarkably consistent:
- You open up, and people start moving around
- 48 days later, your cases start to spike
- 6 days after that, your hospitalizations spike
- 23 days after cases hospitalizations spike people start dying.
These lags are maddening, and disruptive to policy.
- For 48 days after people start moving around, the data doesn’t change at all. Politicians declare victory over the virus, people get confident, start going to pool parties, the President crows about jobs numbers.
- Then at day 48, we see cases spike. “Oops! But hey, it’s just young people, and unlike in New York, the cases aren’t serious – nobody’s checking into hospitals!” We only get to say this for 6 days, when…
- …On day 7, we start to see hospitalizations going up. “heh, well, it’s ok because nobody’s dying – the cases are serious but still not grave, plus our DEATH RATIO is dropping as deaths aren’t going up but cases are skyrocketing! We’ve beaten this thing!”
- We get to be in this state for a full 22 days – three weeks. Then people start dying, following the exponential curve but on a 7-8 week lag from cases and a 2 MONTH lag from opening up.
This is devilish, almost designed to allow us to be stupid in spite of copious data.
