
We continue to see a long, gradual slide to zero new cases or deaths.
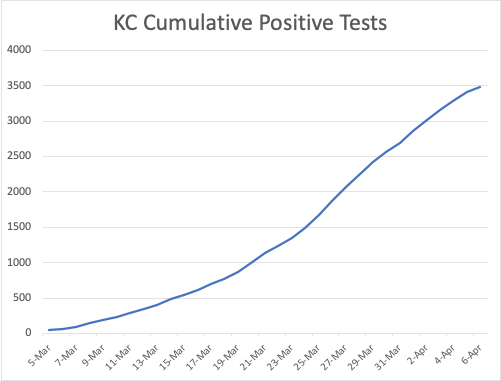
The Test cumulative curve is slowly heading towards horizontal, where the daily % increase curve is at 0%. Today, we increased cases at 3%.

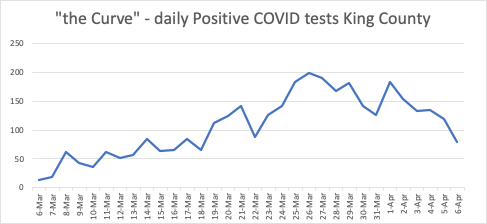
My “the curve” chart of daily absolute new cases is actually starting to plummet downwards, from its peak at 200 cases per day to only 80 today.
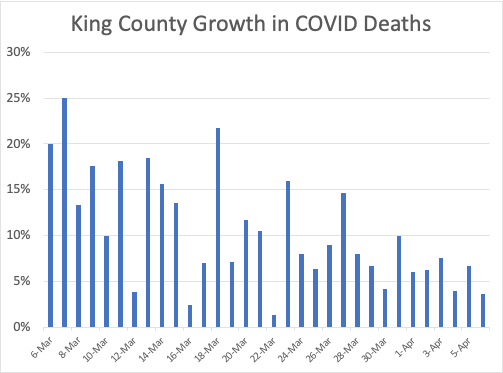
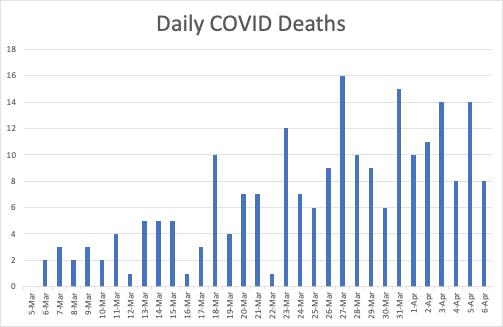
There’s continuing good news on deaths, too – we may actually be starting to gradually trend downwards, although these small numbers may be noisy.
A quick note on Methodology
I thought I’d call out one thing on the King County website. The have the lovely summary widget shown below:

This shows that we added 155 cases to come to 3486. That’s true, but if we dig deeper we find that a number of the additional tests were in fact allocated to previous days. The next graph shows that only 80 of the tests were reported on 4/06, which is the number I report here.

